Student Achievement Data
The institution evaluates success with respect to student achievement consistent with its mission. Criteria may include: enrollment data; retention, graduation, course completion, and job placement rates; state licensing examinations; student portfolios; or other means of demonstrating achievement of goals. (Student achievement)
Lamar Institute of Technology (LIT) demonstrates the achievement of its institutional mission and goals in regard to student achievement by publishing appropriate multiple student achievement data (totals and disaggregated by race/ethnicity) as reported on the National Student Clearinghouse (Total Completion Rate), the Texas Higher Education Coordinating Board’s Accountability System and IPEDS College Navigator system.
Criterion 1: National Student Clearinghouse 6-year total graduation rate
Goal: Increase the 6-year total completion rate to 45% by 2030.
National Student Clearinghouse
(Total Completion Rates)
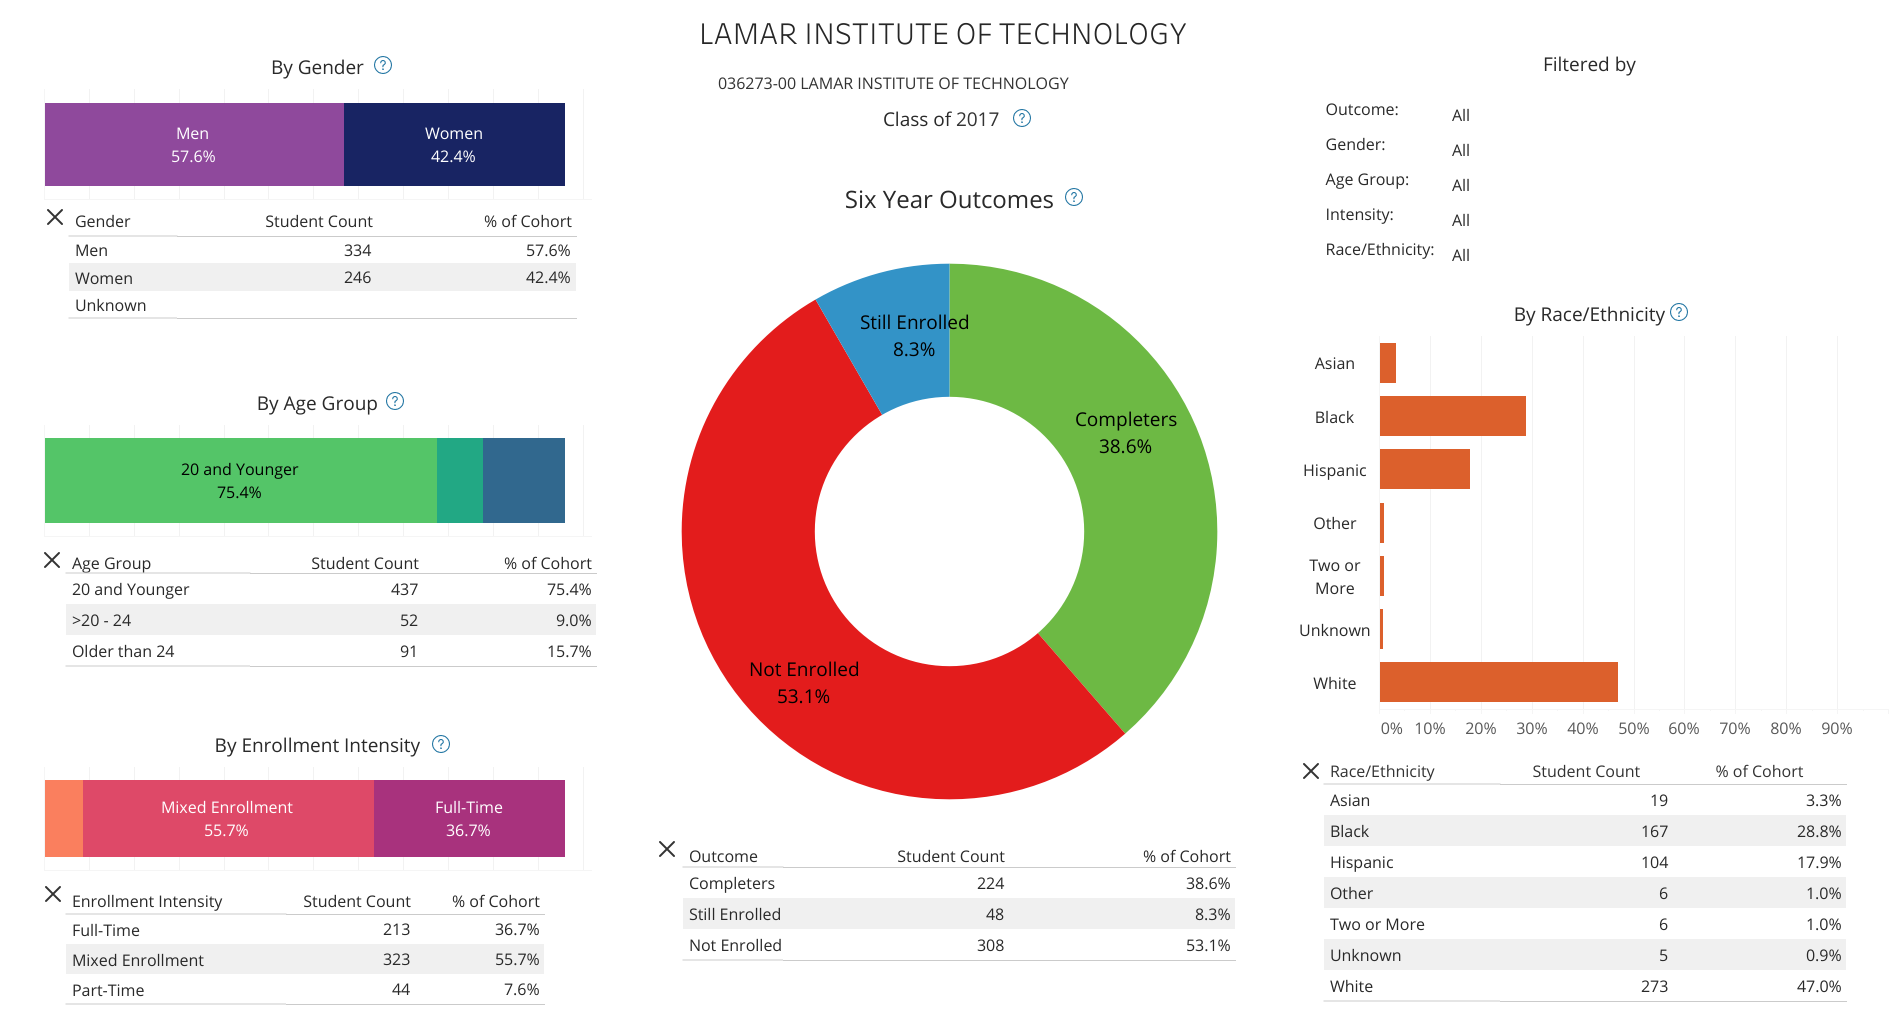-disaggregated.png?lang=en-US "National-Student-Clearinghouse-Completions-dashboard-(2016)-disaggregated-(1).png")
Criterion 2: Enrollment
Goal: Maintain steady enrollment growth of 6%.
Texas Higher Education Coordinating Board’s Accountability System
| Enrollment by Race/Ethnicity* | |||||||
| Community, State and Technical Colleges | |||||||
| Fall 2022 | Fall 2023 | Fall 2024 | |||||
| Institution | Race/Ethnicity | Headcount | Percent | Headcount | Percent | Headcount | Percent |
| Lamar Institute of Technology | African American | 1,444 | 30.2% | 1,388 | 26.4% | 1,493 | 26.6% |
| Hispanic | 1,163 | 24.3% | 1,342 | 25.5% | 1,393 | 24.8% | |
| Asian | 141 | 3.0% | 154 | 2.9% | 148 | 2.6% | |
| Other | 245 | 5.1% | 423 | 8.0% | 419 | 7.5% | |
| International | 0 | 0.0% | 0 | 0.0% | 0 | 0.0% | |
| White | 1,795 | 37.8% | 1,954 | 37.1% | 2,153 | 38.4% | |
| Total: | 4,788 | 100.0% | 5,261 | 100.0% | 5,606 | 100.0% | |
| Annual Growth: | 7% | 10% | 7% | ||||
| *Source: THECB, CBM0C1 | |||||||
Criterion 3: Degrees and Certificates Awarded
Goal: Increase the number of degrees and certificates awarded by 5% annually.
| Degrees and Certificates Awarded by Race/Ethnicity* | |||||||
| Community, State and Technical Colleges | |||||||
| FY 2022 | FY 2023 | FY 2024 | |||||
| Institution | Race/Ethnicity | Awards | Percent | Awards | Percent | Awards | Percent |
| Lamar Institute of Technology | African American | 275 | 27.7% | 331 | 30.7% | 287 | 26.9% |
| Hispanic | 207 | 20.9% | 241 | 22.4% | 258 | 24.2% | |
| Asian | 31 | 3.1% | 35 | 3.2% | 30 | 2.8% | |
| Other | 17 | 1.7% | 23 | 2.1% | 59 | 5.5% | |
| International | 0 | 0.0% | 0 | 0.0% | 0 | 0.0% | |
| White | 462 | 46.6% | 448 | 41.6% | 431 | 40.5% | |
| Total: | 992 | 100.0% | 1,078 | 100.0% | 1,065 | 100.0% | |
| Annual Growth: | 15% | 9% | -1% | ||||
| *Source: THECB, CBM009 | |||||||
Criterion 4: Six-year Degrees and Certificates Awarded
Goal: Maintain a six-year award rate within 5% of the state average for two-year institutions.
| Six-Year Graduation Rates by Race/Ethnicity at Two-Year Colleges* | ||||||||||
| First-time, full-time entering degree-seeking students who enrolled in a minimum of 12 SCH their first fall semester who graduated from the same institution or another Texas public or independent institution. | ||||||||||
| Fall 2016 - FY 2022 | Fall 2017 - FY 2023 | Fall 2018 - FY 2024 | ||||||||
| Institution | Race/Ethnicity | Cohort | Graduated | Rate | Cohort | Graduated | Rate | Cohort | Graduated | Rate |
| Lamar Institute of Technology | White | 210 | 124 | 59.0% | 232 | 123 | 53.0% | 241 | 127 | 52.7% |
| African American | 124 | 28 | 22.6% | 163 | 47 | 28.8% | 165 | 37 | 22.4% | |
| Hispanic | 82 | 46 | 56.1% | 92 | 42 | 45.7% | 118 | 52 | 44.1% | |
| Asian | * | * | * | * | * | * | * | * | * | |
| International | 0 | 0 | 0.0% | 0 | 0 | 0.0% | 0 | 0 | 0.0% | |
| Other | * | * | * | * | * | * | * | * | * | |
| Total: | 434 | 207 | 47.7% | 507 | 219 | 43.2% | 546 | 222 | 40.7% | |
| Statewide: | 44.5% | 44.0% | 44.2% | |||||||
| Difference: | 3.2% | -0.8% | -3.5% | |||||||
| *Source: THECB, CBM0C1, CBM009, & CBM00N | ||||||||||
Criterion 5: Licensure/Certification
Goal: Maintain an overall licensure pass rate of 87% or higher.
Lamar Institute of Technology offers instructional programs that offers or requires a state licensure and/or certification. Instructional programs that are accredited by an accrediting agency include, the Radiologic Technology (Joint Review Commission Education in Radiologic Technology, JCERT ), Dental Hygiene (Commission on Dental Accreditation), Health Information Technology (Commission on Accreditation of Allied Health Programs in cooperation with the Council on Accreditation of the American Health Information Management Association), and Respiratory Therapy (Commission on Accreditation for Respiratory Care, CoARC). Instructional programs recognized by state agencies include, the Police Academy (Texas Commission on Law Enforcement), Emergency Medical Technician (Texas Department of Health), and Fire Academy (Texas Commission on Fire Protection). All programs on the licensing report have a benchmark of student achievement set by either an accrediting agency or program faculty (as recorded in the Annual Assessment Report and Institutional Strategic Plan). Program faculty continually review the program curriculum and discuss curriculum issues with the advisory board. Advisory board input and industry standards are used by program faculty to set an appropriate benchmark for licensing exams.
The Statewide Annual Licensure Report published by the Texas Higher Education Coordinating Board reports the results of licensure and certification exams.
LIT's 2024-2025 licensure data reports a 90% pass rate.
| THECB Annual Licensure/Certification Report Report Year: 2024-2025* |
|||||||
| Major | CIP | Collection Method** |
Exam Type | Licensure Taken |
Licensure Passed |
Success Rate |
|
| Computer Systems Analysis/Analyst | 11050100 | S | Certification | 5 | 5 | 100% | |
| Cosmetology/Cosmetologist, General | 12040100 | A | Licensure | 19 | 13 | 68% | |
| Criminal Justice/Police Science | 43010700 | A | Licensure | 62 | 61 | 98% | |
| Dental Hygiene/Hygienist | 51060200 | A | Licensure | 24 | 23 | 96% | |
| Diagnostic Medical Sonography/Sonographer and Ultrasound Technician | 51091000 | B | Certification | 56 | 54 | 96% | |
| Emergency Medical Technology/Technician (EMT Paramedic) | 51090400 | A | Certification | 270 | 227 | 84% | |
| Fire Science/Firefighting | 43020300 | A | Licensure | 36 | 36 | 100% | |
| Heating, Ventilation, Air Conditioning and Refrigeration Technology/Technician | 15050100 | A | Certification | 8 | 8 | 100% | |
| Health Information/Medical Records Technology/Technician | 51070700 | A | Certification | 6 | 4 | 67% | |
| Industrial Mechanics and Maintenance Technology | 47030300 | A | Certification | 9 | 9 | 100% | |
| Pharmacy Technician/Assistant | 51080500 | A | Certification | 11 | 9 | 82% | |
| Radiologic Technology/Science - Radiographer | 51091100 | A | Certification | 34 | 30 | 88% | |
| Real Estate | 52150100 | A | Licensure | 8 | 8 | 100% | |
| Registered Nursing/Registered Nurse | 51380100 | S | Certification | 30 | 30 | 100% | |
| Respiratory Care Therapy/Therapist | 51090800 | A | Certification | 6 | 5 | 83% | |
| Welding Technology/Welder | 48050800 | A | Certification | 10 | 10 | 100% | |
| Total: | 594 | 532 | 90% | ||||
| *Rates based on Program-Level Reporting | |||||||
| **Method of Data Collection: | |||||||
| A = Agency Reporting | |||||||
| S = Student Self Reporting | |||||||
| B = Both | |||||||